The Power of a Single Percentage Point: How Your TFSA Can Change with Just 1%
For many young Canadians, the Tax-Free Savings Account (TFSA) is their first major step into the world of investing. While the prospect of building a retirement nest egg or saving for a down payment might seem like a marathon, the truth is that your investment journey is less about a sprint and more about a steady, consistent pace. The difference between an average result and a truly life-changing one can come down to a single, seemingly insignificant factor: a 1% difference in your rate of return.
This isn’t about chasing risky, high-flying stocks or trying to time the market. It’s about understanding the silent, exponential force of compounding interest. Over a long enough timeline, even the smallest advantage in your investment returns can create a massive financial gap, leaving you with hundreds of thousands of dollars more in your pocket. Let’s break down exactly how this plays out in your TFSA over 30 years.
A Simple Scenario with a Powerful Outcome
To illustrate this, let’s look at a realistic scenario for a young Canadian investor, a scenario you might find yourself in. Imagine you start your TFSA journey with an initial investment of $7,000, which is the current annual TFSA contribution limit. You then commit to maxing out your TFSA every year by contributing an additional $7,000 annually for the next 30 years.
Now, let’s explore three different investment paths, each with a slightly different—but crucially important—annual rate of return:
- Path 1: A consistent 8% annual return, which is a common long-term average for a well-diversified portfolio of stocks.
- Path 2: A 9% annual return, just one percentage point higher. This could be achieved through a slightly more aggressive investment strategy, lower fees, or simply being a little luckier with your choices.
- Path 3: A 10% annual return, two percentage points higher than the first path
Over the first few years, the results will look very similar. The lines on the chart below will barely be separated, and the difference in your total balance might only be a few hundred dollars. This is where most people lose patience. They see little progress and get discouraged. But what happens if you stay the course for three full decades?
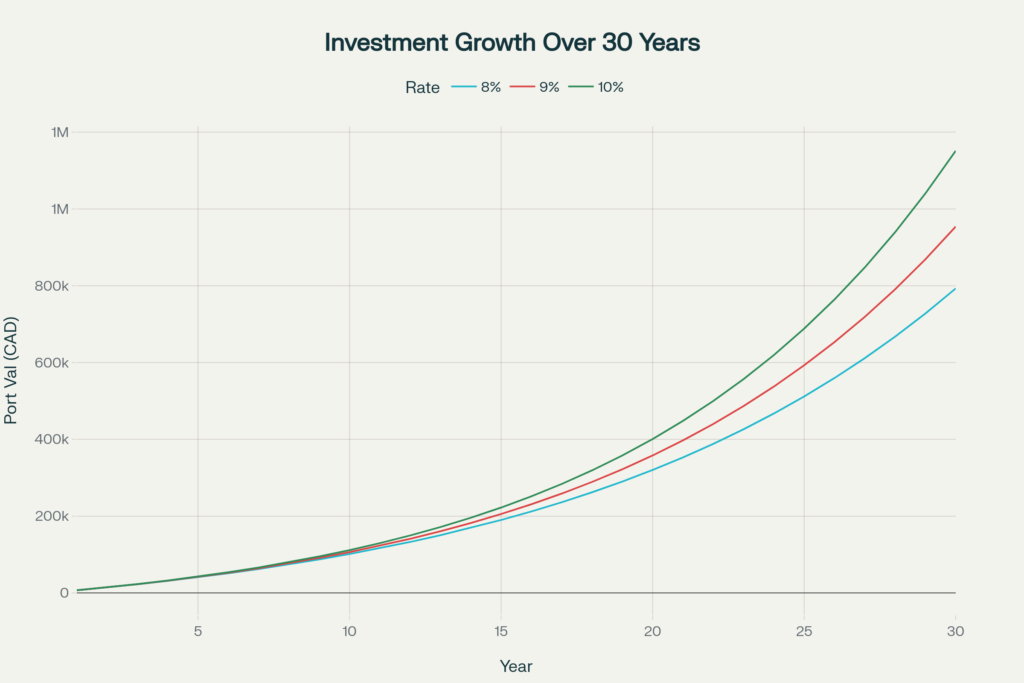
As you can see from the chart, the curves for each rate of return start to pull apart with increasing speed, and the final results are staggering.
That’s why it is important to chose good funds.
